
With the arrival of IGAPS, merging data products from the IPHAS and UVEX surveys, a website superseding this one is now available: go to
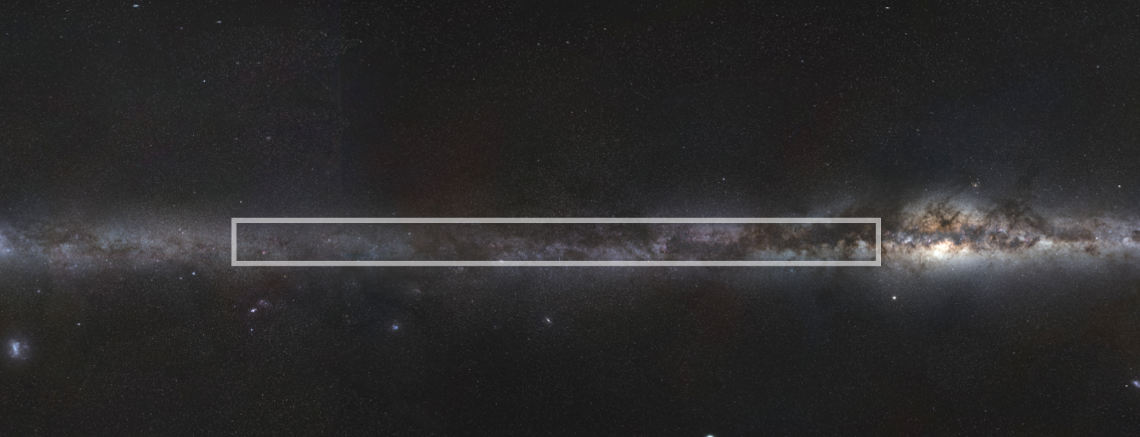
Read the survey description » IPHAS is imaging the Northern Milky Way in visible light (Hα, r, i) down to >20th magnitude, using the Isaac Newton Telescope (INT) in La Palma.
Image: ESO/S. Brunier
Access the catalogue »
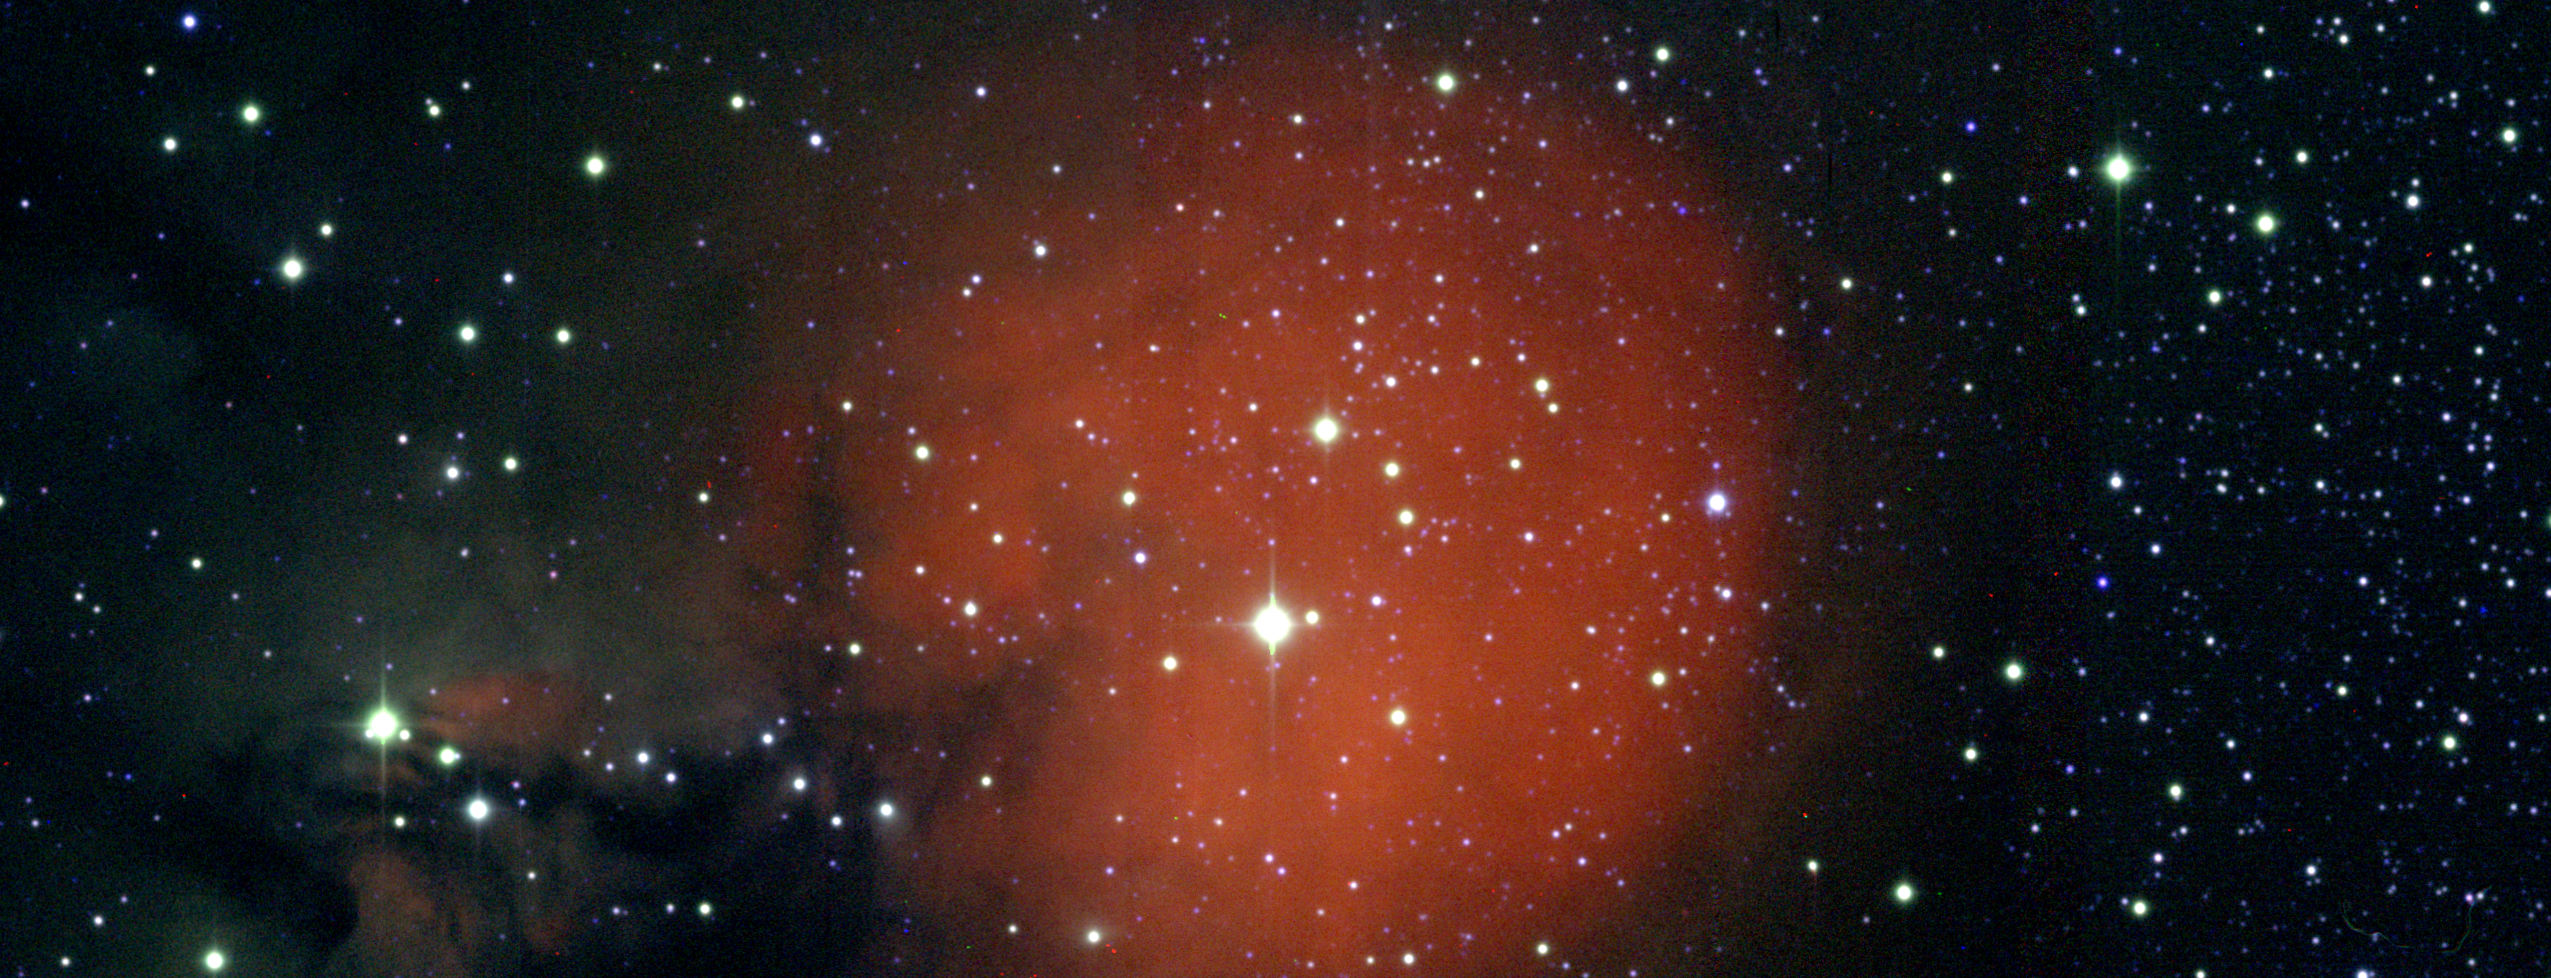
IPHAS DR2 has been published by Barentsen et al (2014),
providing a catalogue of 219 million unique sources.
Image: IPHAS/G. Barentsen
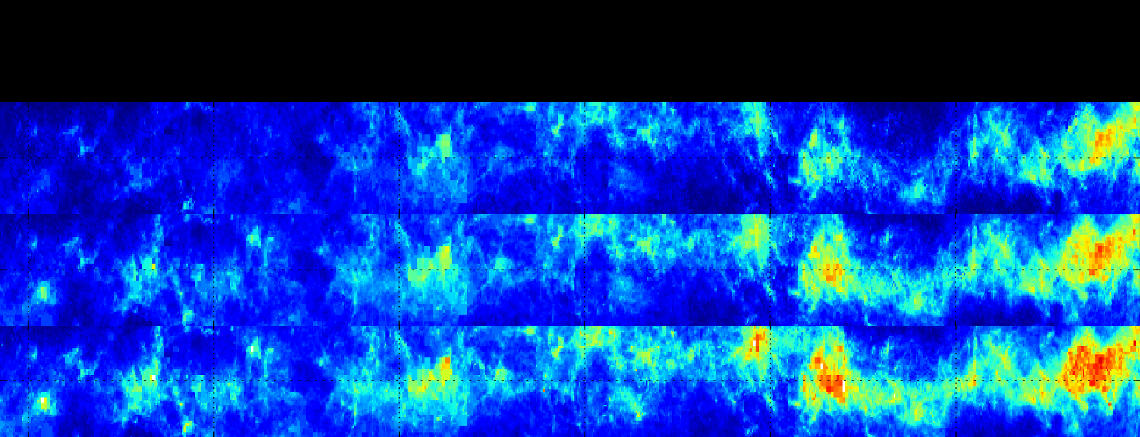
Access the map »
A 3D extinction map of the Galactic Plane
has been published by Sale et al (2014).
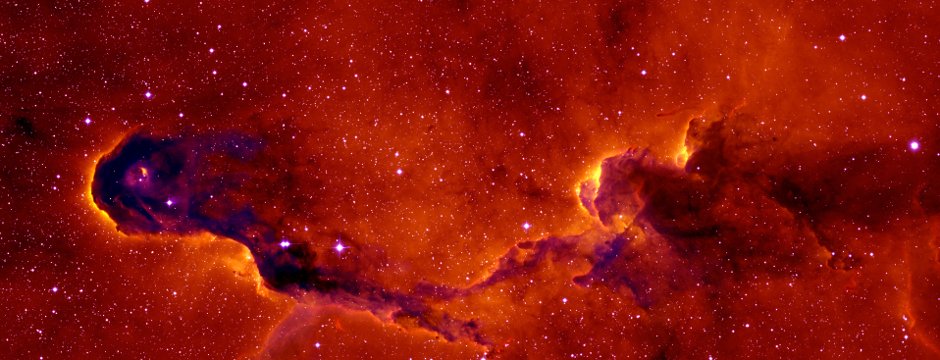
Access the images »
Our pipeline-processed imaging data
is now available from this website.
Image: IPHAS/N. Wright
Read the paper on ADS »
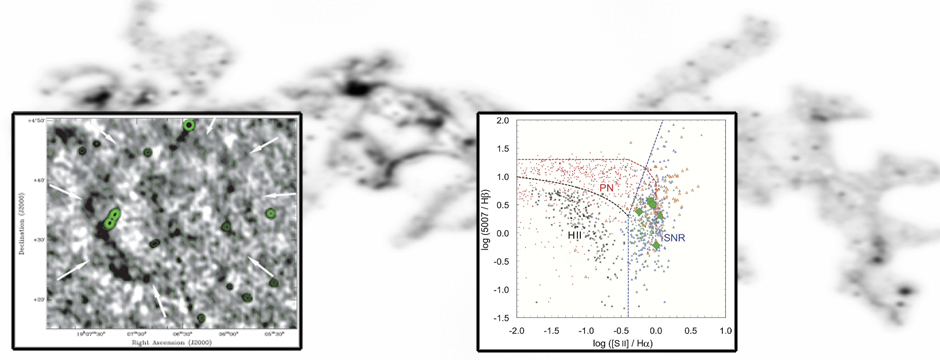
Five new supernova remnants have been discovered
using IPHAS H-alpha images.
The results are published in Sabin et al. 2013.
IPHAS surveys the Galactic Plane at -5° < b < +5° and 29° < l < 215° in r, i, and Hα down to >20th magnitude.
The IPHAS (r-Hα, r-i) colour-colour plane enables a broad range of science going beyond the selection of emission line stars.
Our public data products include a photometric catalogue, imaging data, and a 3D extinction map.
Our images can be used to construct wide-area mosaics of star-forming regions and extended objects.
Over 70 ADS entries mention IPHAS in the title, while over 170 mention IPHAS in the abstract.
How to get in touch; graduate student opportunities; the names and places involved in IPHAS.